State of Stock-Based Compensation 2026 · Carver Edison
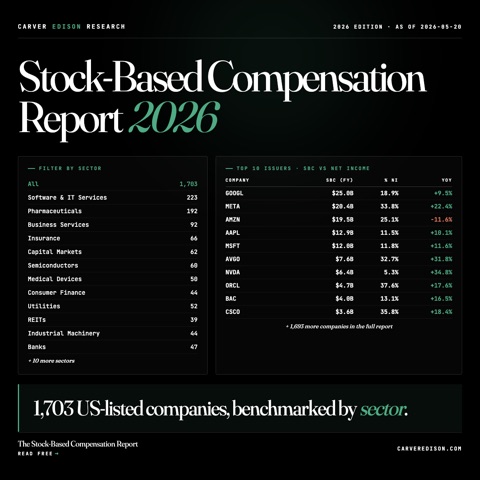
The 2026 State of Stock-Based Compensation Report.
We pulled the numbers across 1,588 US-listed companies that had material SBC expenses. Three things stood out:
- At 584 of these companies, stock compensation was larger than net income.
- At the median company, SBC runs about 9% of operating cash flow. In software, more than 40%. In semiconductors, more than a quarter.
- It is spreading well beyond Big Tech. Banks grew it 15% year over year; capital markets firms grew it 23%.
See the full breakdown, every sector, every percentile, and where your company lands.
Some of the companies inside
MetaAlphabetAppleMicrosoftAmazonNvidiaBroadcomOracleSalesforceAMDIntelCiscoIBMDellUberJohnson & JohnsonAbbVieMerckGileadAccentureGoldman SachsMorgan StanleyBlackstoneBlackRockCVS HealthPalo Alto NetworksMetaAlphabetAppleMicrosoftAmazonNvidiaBroadcomOracleSalesforceAMDIntelCiscoIBMDellUberJohnson & JohnsonAbbVieMerckGileadAccentureGoldman SachsMorgan StanleyBlackstoneBlackRockCVS HealthPalo Alto Networks